
Medium
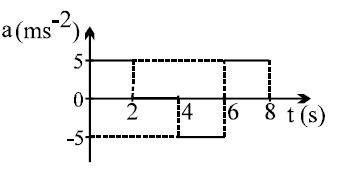
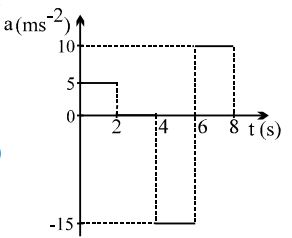
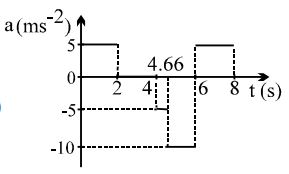
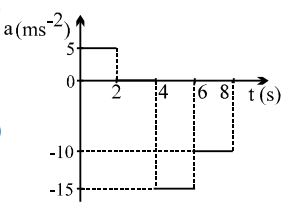
The figure shows a velocity-time graph of a particle moving along a straight line. The correct acceleration-time graph of the particle is shown as:
- A
- B
- C
- D
Explore More
Similar Questions
The given graph shows the variation of velocity $v$ with displacement $x$. Which one of the graphs given below correctly represents the variation of acceleration $a$ with displacement $x$?
DifficultIIT 2005
View SolutionSuggest a suitable physical situation for the following $x-t$ graph.
Easy
View SolutionThe position-time graphs for two students $A$ and $B$ returning from the school to their homes are shown in the figure.
$(A)$ $A$ lives closer to the school.
$(B)$ $B$ lives closer to the school.
$(C)$ $A$ takes less time to reach home.
$(D)$ $A$ travels faster than $B$.
$(E)$ $B$ travels faster than $A$.
Choose the correct answer from the options given below:
$(A)$ $A$ lives closer to the school.
$(B)$ $B$ lives closer to the school.
$(C)$ $A$ takes less time to reach home.
$(D)$ $A$ travels faster than $B$.
$(E)$ $B$ travels faster than $A$.
Choose the correct answer from the options given below:
From the given $v-t$ graph,find the ratio of distance to displacement in $25\,s$ of motion.
$A$ car accelerates from rest at a constant rate $\alpha$ for some time after which it decelerates at a constant rate $\beta$ to come to rest. If the total time elapsed is $t$ seconds,the total distance travelled is
DifficultJEE MAIN 2021
View SolutionVedclass Products
For Students
Vedclass Test Series
Mock tests in real JEE/NEET style with performance analysis. 5-day free trial.
Start Free TrialFor Teachers
Exam Paper Generator
Generate Set A/B/C/D exam papers from 7.5L+ questions in 2 minutes. 3 chapters free.
Try FreeFor Institutes
Online Exam Module
Live online exams with unlimited students, 360° analytics & white-label branding.
See Demo